


Search Results for Tag: data journalism
Getting online data to offline communities
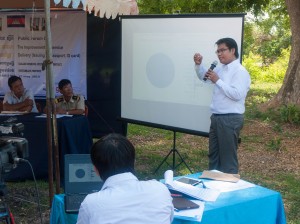
Bringing online data to a rural, offline community (photo: Kyle James)
Data journalism has opened up new ways of telling compelling stories, finding connections and creating visuals that explain important, complex issues is easy-to-understand ways.
This has become possible through the huge range of digital information now available online. While much of that information is presented online and sometimes in newspapers and magazines, what about communities who don’t have much access to the internet or even printed media?
Are these communities, often poor and rural, simply going to miss out on the results and benefits of data journalism? Not necessarily. onMedia’s Kyle James looks at a project in Cambodia that has been linking online and offline communities – with promising results.
![]() read more
read more


![]()
Tools and Apps for Journalists: Tableau
![]() If you want a novel way of visualizing masses of complicated data, or you are looking for an alternative to Datawrapper, then Tableau Public could be your choice for creating state-of-the-art interactive graphs, charts and maps.
If you want a novel way of visualizing masses of complicated data, or you are looking for an alternative to Datawrapper, then Tableau Public could be your choice for creating state-of-the-art interactive graphs, charts and maps.
“We used Tableau because we had no programmer” says @PauGuisado at #dhplus .This sentence is becoming a #ddj mantra.
— daniele grasso (@danielegrasso) May 9, 2014
What is Tableau?
Tableau Public is free software which allows you to visualize data in many ways and create all kinds of maps, charts and graphs (and there are pay versions of Tableau too). A great function of Tableau is the ability to put multiple data sets together into a so-called “Dashboard”, which among other things, allows the filtering of results. This is one of the software’s strengths because it lets you analyze the data in more detail. For example, in the visualization I produced below of net energy imports, you can click on a particular year and a particular region to see how energy use is changing.
How can journalists use Tableau?
Unlike several other web-based services, you need to download and install the software onto your computer (only available for Windows). You then open up your data and drag and drop to create different types of charts or maps. Then you can upload the results publicly to the web. You can then embed the visualizations in your own website or easily share it via social media.
Is Tableau easy to learn?
In short, yes. But I recommend that you first take a look at this helpful introductory video:
By following the steps in the video, it should be quite straightforward to start creating basic visualizations. But if you want to do more complicated work, you’ll probably have to take some additional time to play around and explore all the software’s features. It took me a few hours to create the visualization shown above, but this also included time spent cleaning up and arranging the World Bank data in Excel (if you would like to have a go at doing this on your own, look at my spreadsheet on Google Drive).
Advantages
Apart from the introductory video above, many other great tutorial videos are available. Some data journalists advise you to visualize your data in as many ways as possible so you don’t miss any patterns. This is simple with Tableau – once you have uploaded your data, it suggests appropriate visualizations methods. The filters are easy to add and you can configure them so that they are interactive. Everything is highly customizable: you can change colors, alter fonts and adjust text sizes just as needed. All this is done offline. Once you’ve installed Tableau you can start working on your computer. The internet is only required when you save your project to the web.
Disadvantages
Tableau is however not as intuitively hands-on as Datawrapper. I tried to start using Tableau straight after installing the program, but quickly realized that I’ll have to watch some how-to-videos. Another con is that once you’ve uploaded your data set, you cannot refine it within the program. You would have to change it within the spreadsheet itself and then upload it again. Though it is great to have many ways to customize your visualization, it is not always that easy to do. I found it time consuming to set the right color steps for my map or to choose the boundaries of the scale within a sheet, for example. Another annoyance was that sometimes when I dragged and dropped elements to the Dashboard, they didn’t drop where I wanted them to and I had to spend time reorganizing the elements. It means you better sit back for a moment to think of what you want your final structure to look like to avoid frustration (get some tips on this here).
Upshot
All these cons would not keep me from using Tableau. It is an interesting tool with a great variety of options. For simple graphics I would still use the Datawrapper. But for more sophisticated visualizations, I would go for Tableau – simply because then you can explore your data in more ways and put all your graphics together neatly in order to tell a multifaceted story.
For some more examples of what Tableau Public can do, take a look here.
Written by guest author, Gianna Grün.
 Gianna Grün is a science journalist with a penchant for data. She works for Global Ideas, Deutsche Welle’s multimedia magazine on biodiversity and climate protection. She also has her own blog, where – among other things – she writes about what’s going on in the data world and takes data tools for a test drive (in English and in German). And in case you prefer to read German, here’s her German post on Tableau.
![]()
Coding for journalists: 10 hottest websites to teach yourself to code
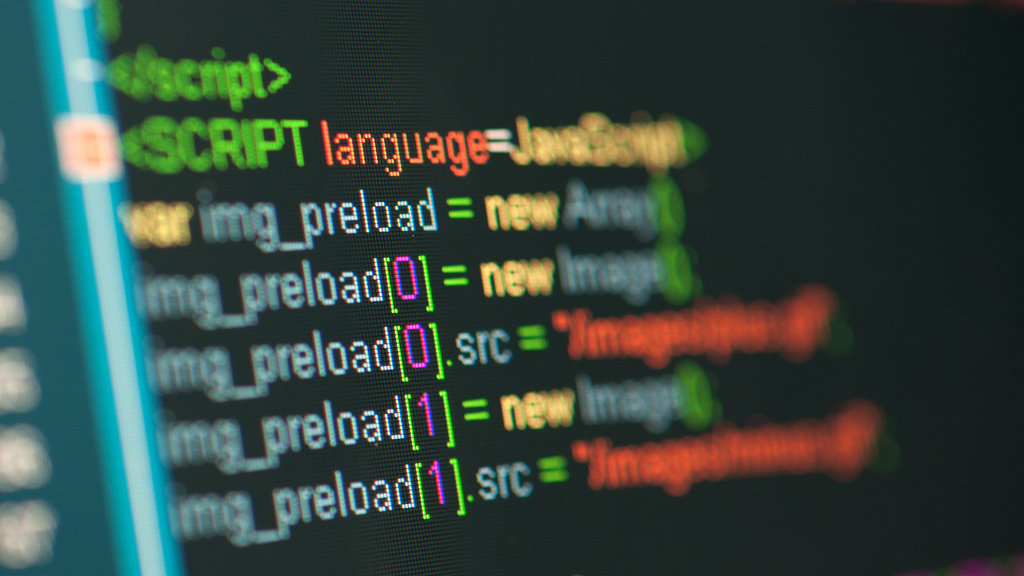
Photo – Fotolia/spaxiax
Should journalists learn computer code? That’s a controversial question at the moment. The general consensus seems to be that today’s journalists need at least a basic level of technical literacy so when they team up with developers, they can better understand the language they speak. To get journalists up to speed, onMedia has prepared an overview of the best websites to help learn how to write code without having to turn into a hard-core programmer.
![]() read more
read more
![]()
Calling for applications for data-driven journalism workshop, Cambodia

Photo by Calvinius via Wikimedia Commons
DW Akademie will conduct a two-week workshop on data-driven journalism in the Cambodian capital, Phnom Penh from January 20 – 31, 2014.
Cambodian journalists, citizen journalists, IT or social media specialists, journalism students and journalism trainers are invited to apply to take part in this training course.
You can find out more about the workshop and download the application documents below.
Please note that the application deadline for the workshop has been extended to Tuesday, December 31, 2013.
1 Call for Applications ‘Data-driven Journalism’
2. Project Outline ‘Data-driven Journalism’
3 Application Form ‘Data-driven Journalism’
4. Employers Declaration ‘Data-driven Journalism’
Good luck with your applications and feel free to share information about the workshop with others who might be interested.
![]()
Data journalism’s social future
Twelve renowned journalists from Latin America and Germany are coming together to explore the future of data journalism. Under the motto “Public Data Goes Social”, the journalists and open data experts will meet for three days in Buenos Aires to discuss the most burning issues in the booming field of data journalism.
The talks are part of a Media Dialogue organized by DW Akademie and supported by Germany’s Federal Foreign Office. You can follow the event, which runs from 13-15 November, on Twitter via @dw akademie and the hashtag #mdba.
There is a thriving community of data journalists in Germany and Latin America and the two regions are building a reputation for innovations in the field. Read more for a short introduction to the Media Dialogue participants.
![]() read more
read more
![]()
Gregor Aisch: ‘Journalists need to overcome their fear of hackers’
 Interactive visualizations and info-graphics are gaining popularity in the media. More and more journalists are becoming interested in producing data-driven stories on their own or with the help of developers. So what do aspiring data journalists need to know? What do they need to keep in mind when working with developers, how much programming do journalists actually need to understand – and what are the best tools to get started?
DW Akademie’s Natalia Karbasova talked to the German visualisation architect and interactive news developer Gregor Aisch. Among other things, Gregor has worked on the development of Datawrapper, a tool that allows journalists to build simple interactive charts. He also develops visualizations for media organisations such as Deutsche Welle and Zeit Online.
“Journalists need to overcome their fear of the so called hackers,“, says Gregor. “This might sound funny to some, but many people still have these mental image of criminal suspects spending their days and nights writing viruses and trying to crack security systems of banks and governments”.
![]() read more
read more
![]()
Giannina Segnini: “Journalism needs to go global”
 Stories based on the offshore leaks investigations into tax havens have shaken political and financial institutions around the world since they first started appearing in April. Now the leaked data has been released as an online database available to everyone.
Thanks to an interactive web app developed by the investigative unit at the Costa Rican newspaper, La Nacion, users can search and visualize information on more than 100,000 secretive companies, trusts and funds in offshore financial centers.
The database, launched in June 2013 by the International Consortium of Investigative Journalists (ICIJ) is part of a cache of 2.5 million leaked files. The data has already been analyzed by around 100 journalists working at 58 media organizations in what has been called the largest journalism collaboration in history.
DW Akademie caught up with Giannina Segnini, who heads La Nacion’s investigative unit, on the sidelines of the Global Media Forum where Segnini was taking part in a panel discussion about data-driven journalism.
In her interview with Steffen Leidel, Segnini talks about the Offshore Leaks Database and the increasing need for reporters to collaborate, not just with each other, but also with computer programming experts. (You can read her article about building the database here.)
![]() read more
read more
![]()
Dan Sinker: ‘Journalism’s future is on the open web’
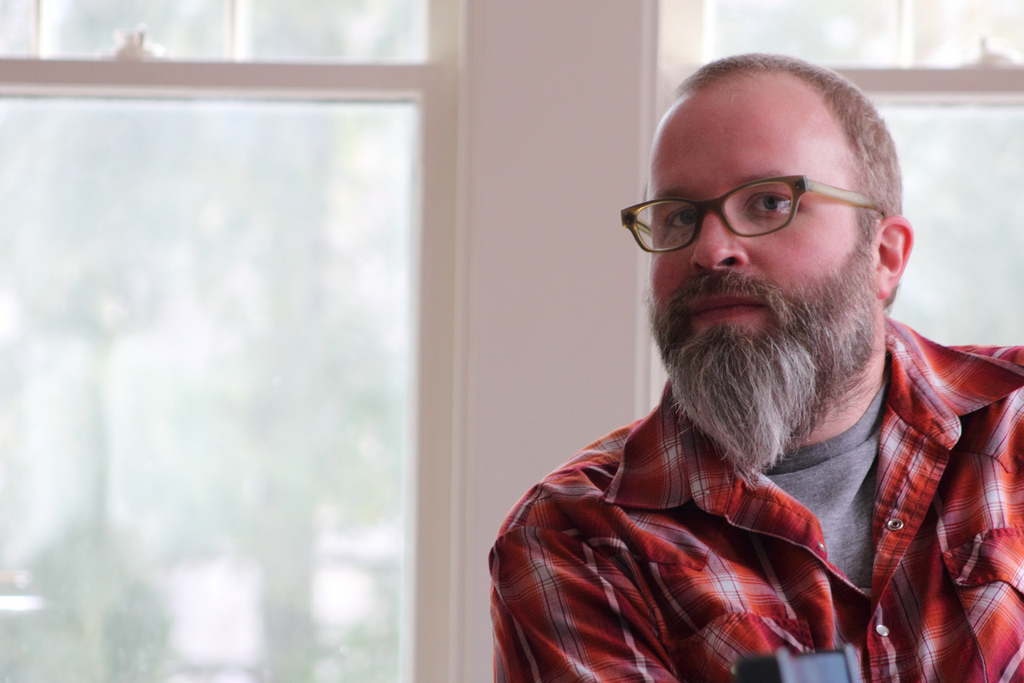
Dan Sinker by Daniel X. O’Neil (Flickr: danxoneil) under a Creative Commons Attribution 2.0
New media is pushing the boundaries of journalism by introducing new technologies. But the question is how newsrooms and journalists can innovate without having to dive into the programming world themselves. This is where the Knight-Mozilla Fellows come in.
The Knight Foundation has long supported quality journalism and journalistic innovation. In 2012, they teamed up with the Mozilla Foundation, which actively promotes an open internet and open source software. The two created the OpenNews partnership with the idea of bringing journalism and technology together.
In 2013, Knight-Mozilla Fellows are hacking newsrooms at the prestigious media organizations such as the New York Times, the BBC, the Guardian, Zeit Online, Spiegel Online, the Boston Globe, ProPublica and La Nacion.
DW Akademie’s Steffen Leidel met with the head of the Knight-Mozilla OpenNews project, Dan Sinker. They talked about why hackers are interested in working with journalists in the first place, how journalists can tap into the world-wide community of hackers and a revolutionary new piece of software for data scraping.
![]() read more
read more
![]()
Justin Arenstein: Hacks and hackers working together in Africa
 As new media continues to reshape the world of journalism, newsrooms need to reinvent themselves to stay relevant. But not all journalists and organizations have the technological skills to become innovative news providers. This is where Hacks/Hackers is stepping in to fill the gap. Hacks/Hackers is a grassroots journalism organization which brings together journalists and software developers. Originating in the United States, chapters of the movement are rapidly spreading around the globe, including Africa. The idea is to hook up hackers (developers and software writers) who sort and visualize information together with hacks (journalists) who are excited about using new technology to tell great stories.
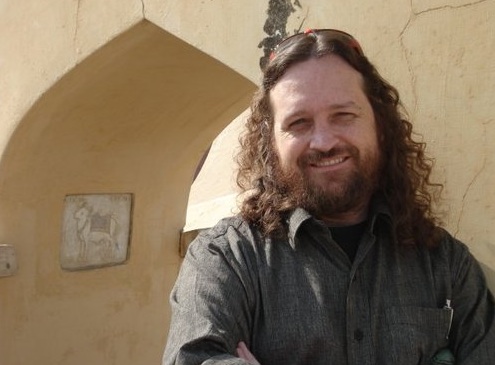 Justin Arenstein is one of the driving figures behind the Hacks/Hackers movement in Africa, where there are currently 13 chapters. Arenstein, a South African, is currently a Knight International Journalism Fellow in charge of the Digital Innovation Program at the Africa Media Initiative. He also is a consulting strategist for Google on data and digital journalism issues (Twitter: @justinarenstein). DW Akademie’s Kate Hairsine talked to him about Hacks/Hackers in Africa.
![]() read more
read more
![]()
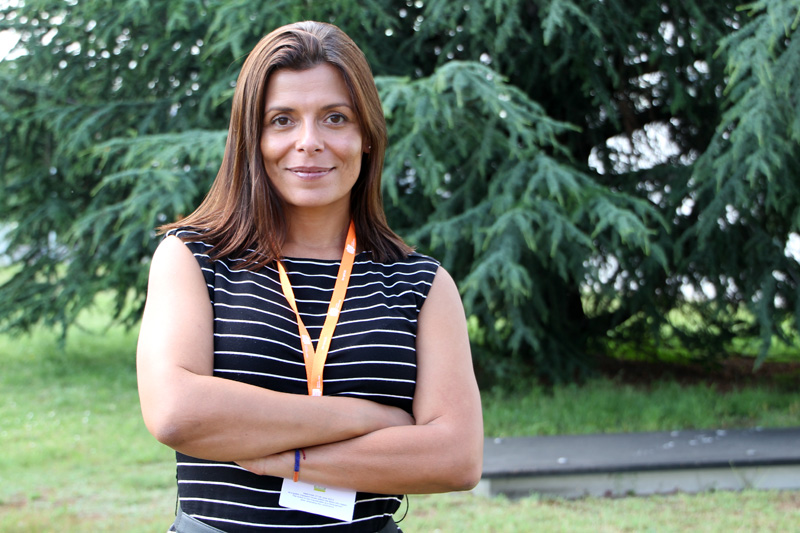
Interview: journalism of the future

Amrai Coen and Caterina Lobenstein on the move
Everyone agrees that journalism is undergoing radical changes. But many questions still remain unanswered about what direction it’s taking. How will stories be told differently in a multimedial future? How will research change as social media, crowd-sourcing and data-driven journalism open up new sources of information? And importantly, how will journalists earn a living as ever increasing numbers of people consume their news online? German journalists Caterina Lobenstein and Amrai Coen sought answers to these burning questions by visiting journalists, bloggers and activists on a whirlwind trip around the world. DW Akademie’s Kate Hairsine talked to Caterina Lobenstein about the search for the journalism of the future.
![]() read more
read more
![]()


Feedback