Creative ways of World Cup storytelling

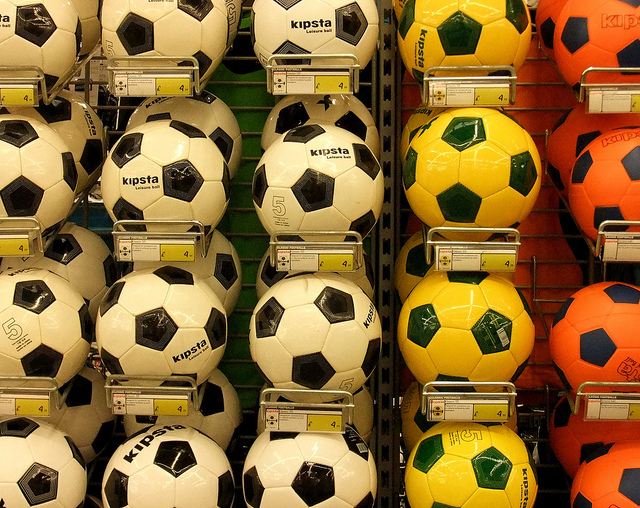
Photo: J Mark Dodds, (CC BY-NC-ND 2.0)
With such a frenzy around everything related to football and the World Cup in Brazil, media departments are madly experimenting with how they can grab readers’ attention. One thing they are doing is coming up with some stunning ways of telling football stories with numbers. From a slick image of the most popular beer in each World Cup country to a map displaying how comfortable different nationalities are about the idea of a national player coming out as gay, there is literally something out there for everyone.
Every day, our colleagues over at DW Innovation are combing the internet for innovative visualizations, infographics and storytelling all around the 2014 Brazil World Cup. Their collection is in a ScribbleLive document embedded below – this means that you just have to check back to this blog post and it will update automatically with DW Innovation’s daily discoveries.


